
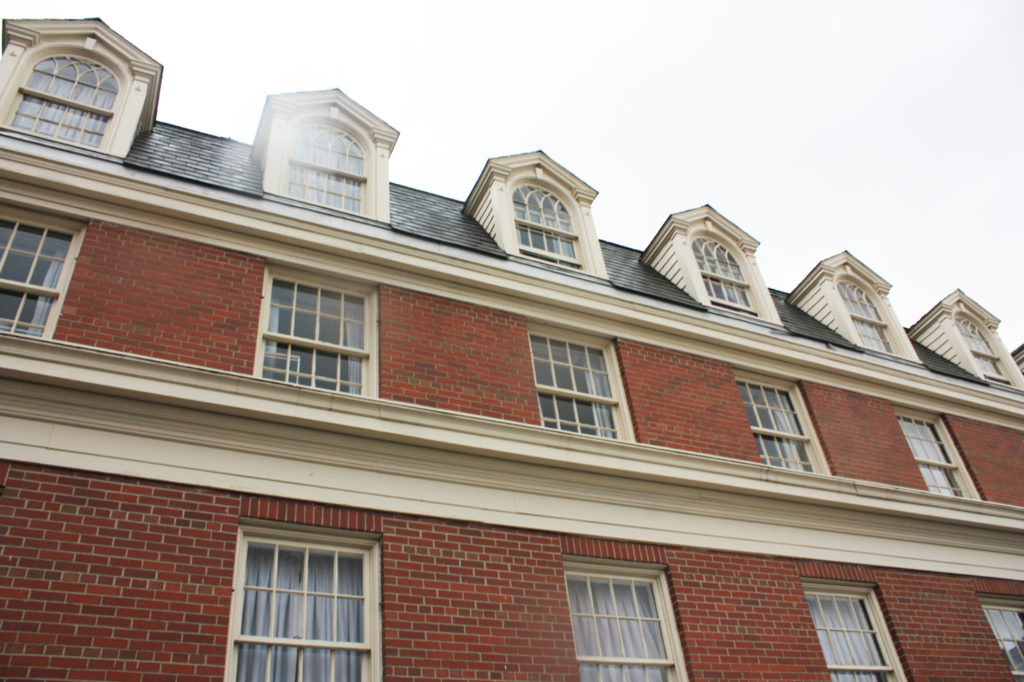
Wilmer-Davis Hall is a residential complex on the Washington State University (WSU) Pullman campus. Built in 1937 by Architect Stanly Smith, with John Maloney, the six-story structure is composed of masonry and concrete with a masonry/brick veneer in the classical and Georgian Revival architectural styles. For a recent feasibility study of the complex, PMA provided an exterior assessment and a limited moisture study utilizing Wärme Und Feuchte Instationär (WUFI), an industry standard application in predicting wall performance to determine how additional insulation may impact the existing constructions and wall performance.
The primary concerns of this analysis included increased potential for freeze thaw action and increased mold growth as a result of added insulation. When historic buildings are insulated the insulation is typically added to the interior of the structure to prevent alterations to the exterior appearance. This often causes the outer layers of the wall to be both colder and wetter as the materials are no longer warmed and dried by the interior heating system. The additional water and more extreme temperatures can result in an increase in freeze thaw action, corrosion of metal reinforcement, and/or increased mold growth.
Additionally adding insulation to a wall changes the location of the dew point within that construction (the point at which vapor in the air condenses into water). A dew point within the middle of the wall can also result in increased moisture within the wall cavity. If a wall has difficulties drying due to any of the above causes it is possible that over the course of several years the quantity of water within the wall will consistently increase. Accumulation of water will exacerbate reinforcement corrosion and mold growth and can result in increased freeze thaw action. This study focused on the following metrics to analyze proposed wall performance: quantity of water in the assembly, quantity of water in each material layer, relative humidity in layers susceptible to mold growth, and isopleths.
MODEL SETUP
As in any simulation analysis a number of assumptions were made regarding the existing wall construction and the proposed design conditions. A variety of different conditions were analyzed in order to explore the range of conditions and variables. Below is a description of the inputs as well as an analysis of the results.
Four (4) proposed wall constructions were analyzed to determine how different types, quantities, and configurations of insulation would impact the existing constructions. The configurations were based on outlined solutions for meeting Washington State Energy Code (WSEC) or providing improved thermal comfort. Two of the proposed constructions meet WSEC (Option 1 and Option 2), while two of the solutions (Option A and Option B) fall short of fully meeting WSEC, but would provide improved insulation values. The options simulated included:
Base Case (Existing Conditions) (R-4.8)
3-1/2” Masonry
1” Air Gap
7-1/2” Hollow Clay Tile Back-Up Wall
1-1/2” Plaster
Option 1 (Meets WSEC) (R-15.4, continuous insulation)
3-1/2” Masonry
1” Air Gap
7-1/2” Hollow Clay Tile Back-Up Wall
1-1/2” Plaster
2” Expanded Polystyrene
Vapor Retarder (1perm)
0” Gypsum
Option 2 (Meets WSEC) (R-20.9, insulation is not continuous)
3-1/2” Masonry
1” Air Gap
7-1/2” Hollow Clay Tile Back-Up Wall
1-1/2” Plaster
3” Batt Insulation
0-1/2” Expanded Polystyrene
Vapor Retarder (1perm)
0-5/8” Gypsum
Option A (R 17.4, insulation is not continuous)
3-1/2” Masonry
1” Air Gap
7-1/2” Hollow Clay Tile Back-Up Wall
1-1/2 Plaster
2” Foamed-In-Place Polyurethane
Vapor Retarder (1perm)
0-5/8” Gypsum
Option B (R-18.4, insulation is not continuous)
3-1/2” Masonry
1” Air Gap
7-1/2” Hollow Clay Tile Back-Up Wall
1-1/2” Plaster
3-1/2” Batt Insulation
Vapor Retarder (1perm)
0-5/8” Gypsum
MATERIALSIt should be noted that no material testing was performed during this phase of the project – instead default material properties were chosen from the WUFI database. Materials used include:
Weather/Interior Conditions In each simulation the model was set to mimic extreme situations to verify that the existing walls will perform in all conditions. The Spokane, Washington weather file indicates that the south elevation should have the most wind driven rain and moisture impacting the wall. Given this information the analysis used south exposure and the Spokane weather file to simulate exterior conditions. For the interior climate conditions the following profiles were used:
The above values represent a relatively high moisture load which is consistent with the existing use as a residential facility.
Water Intrusion Additionally as per ASHRAE 160 a small leak (1% of driving rain) was introduced into the exterior assembly to simulation a scenario where water was penetrating the exterior surface. This could occur at bondline failures in the mortar or penetrations through the wall assembly. The leak was placed past the masonry veneer on the face of the hollow clay tile backup wall.
Initial Conditions Lastly the initial conditions of the materials were determined using ASHRAE 160. For existing wall materials EMC80 was used as the initial moisture content. (EMC80 is a value expressing an equilibrium of water and material masses at 80% humidity). For new components the expectation was that the materials would be installed from the interior and would remain dry during the construction process – thus EMC80 was used for new components as well.
WUFI RESULTS
Four metrics were used to interpret and analyze the following WUFI results: Total Water Content/Water Content in Material Layers, Temperature, Relative Humidity, and Isopleths.
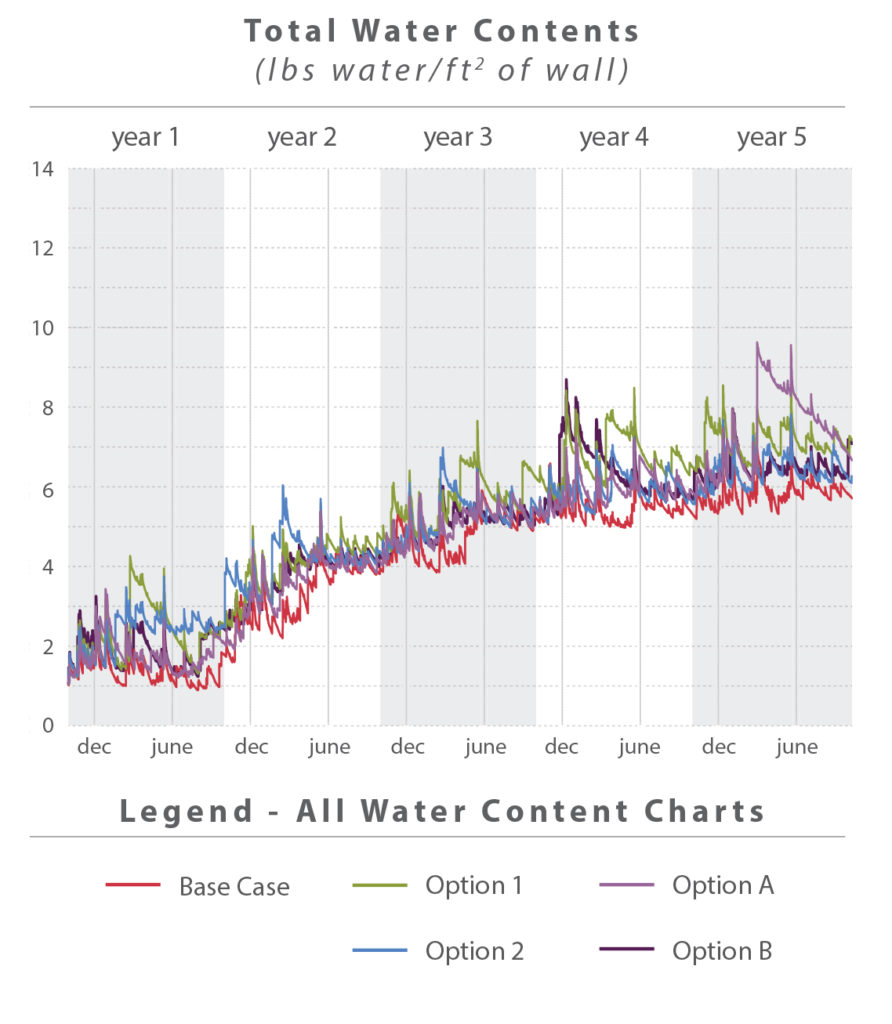 Total Water Content WUFI can predict the total accumulation of water over the time frame of the simulation, in this case five years. Over the course of each year a wall assembly will be wetted by the rain, and dry over the summer months. Differences in humidity and temperature between spaces may cause water condensation within the walls. If conditions do not allow condensation or other water to dry, materials may accumulate water over a period of time.
The chart above shows how each of the different simulations performed. Note that total water content is measured per ft2 of wall. Walls that are thinner (existing construction) will inherently have less capacity to hold water. In general all of the walls performed in a similar manner – an indication that the retrofit strategies should perform in a comparable manner when compared to the existing walls. As can be seen in the chart, all of the simulations, including the base case showed some accumulation of water over the five year simulation. These results, however, do not conclusively show that the proposed walls will accumulate water. The results indicate that even the base case is accumulating water over time. During PMA’s site visit, however, the existing exterior walls appeared to be performing well – which would not be the case if they were consistently accumulating water. Additional analysis showed that the gradual accumulation of Total Water Content appears to be a result of initial instability within the wall construction that equalizes over time. A 20 year simulation showed accumulation over the first five years, after which the water content stabilizes.
Water Content in Material Layers Each of the individual layers of material in a wall assembly have the capacity to hold and retain water. A high water content in any individual layer can indicate the potential for mold growth, the possibility for damage associated with freeze thaw, and a reduction in R-Value based on moisture content. Mold growth is possible when the moisture content is above 20% and if the material has the capacity to feed mold growth. The charts below show how each simulation performed for each layer within the wall.
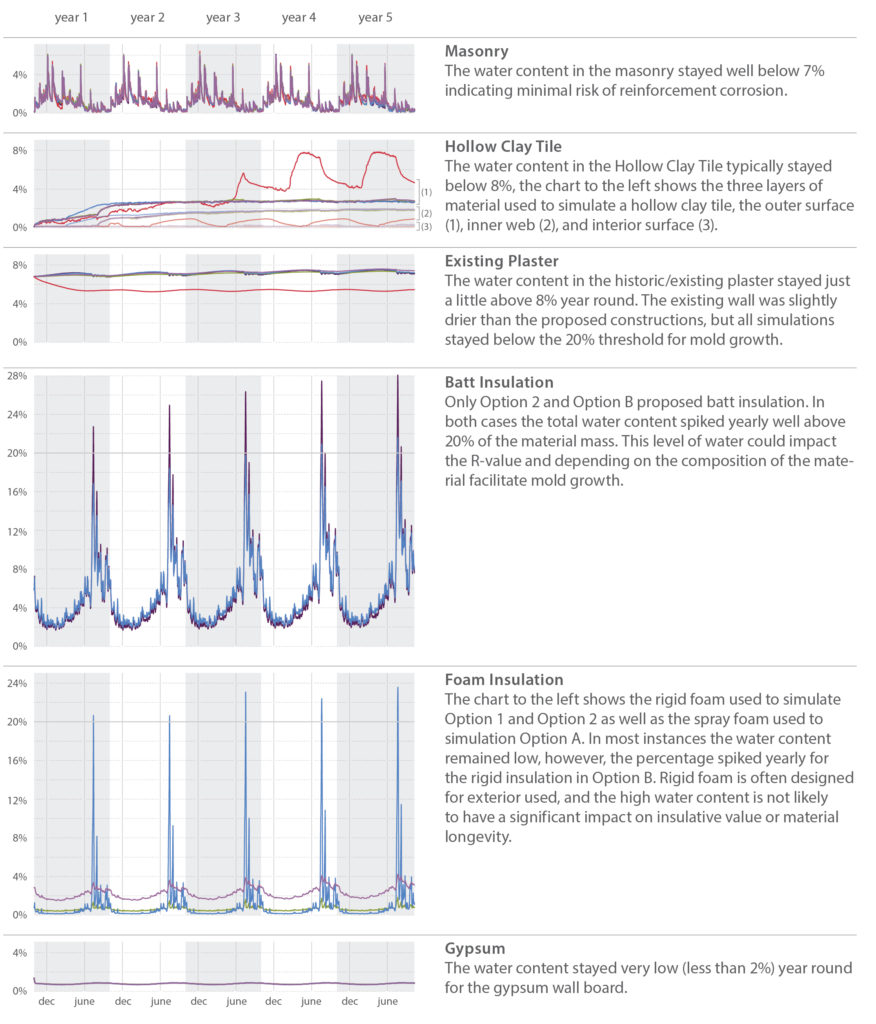 In general most layers remained well below the 20% threshold for mold growth. The insulation layers, however, are an exception. Options 2 and B both had batt and/or foam insulation which yearly exceeded 20% water. This quantity of water is somewhat concerning for the batt insulation as it may reduce the material’s R-Value and/or contribute to mold growth depending on the composition of the material. Solutions that used foam insulation performed better than those with batt insulation.
Temperature One common result of insulating a historic building from the interior is increased freeze thaw action. Insulation prevents the interior conditioned space from heating and drying the exterior masonry. As a result the masonry is typically saturated with more water and exposed to colder temperatures. The analysis looked at the temperature within the middle of the masonry to determine how added insulation would impact the material. A chart comparing the base case to the four options for insulation is located below. As can be seen the brick temperature remains consistent with the base case in all retrofit options. This is an indication that the masonry may not by exposed to additional weathering as a result of added interior insulation. It should be noted that not all masonry reacts to water saturation and freezing conditions in the same manner. To further analyze the masonry’s susceptibility to freeze-thaw action lab analysis is recommended to determine material performance. If results indicate that the masonry is susceptible to freeze-thaw it will be critical to ensure new constructions do not lead to a significantly colder/wetter exterior wall.
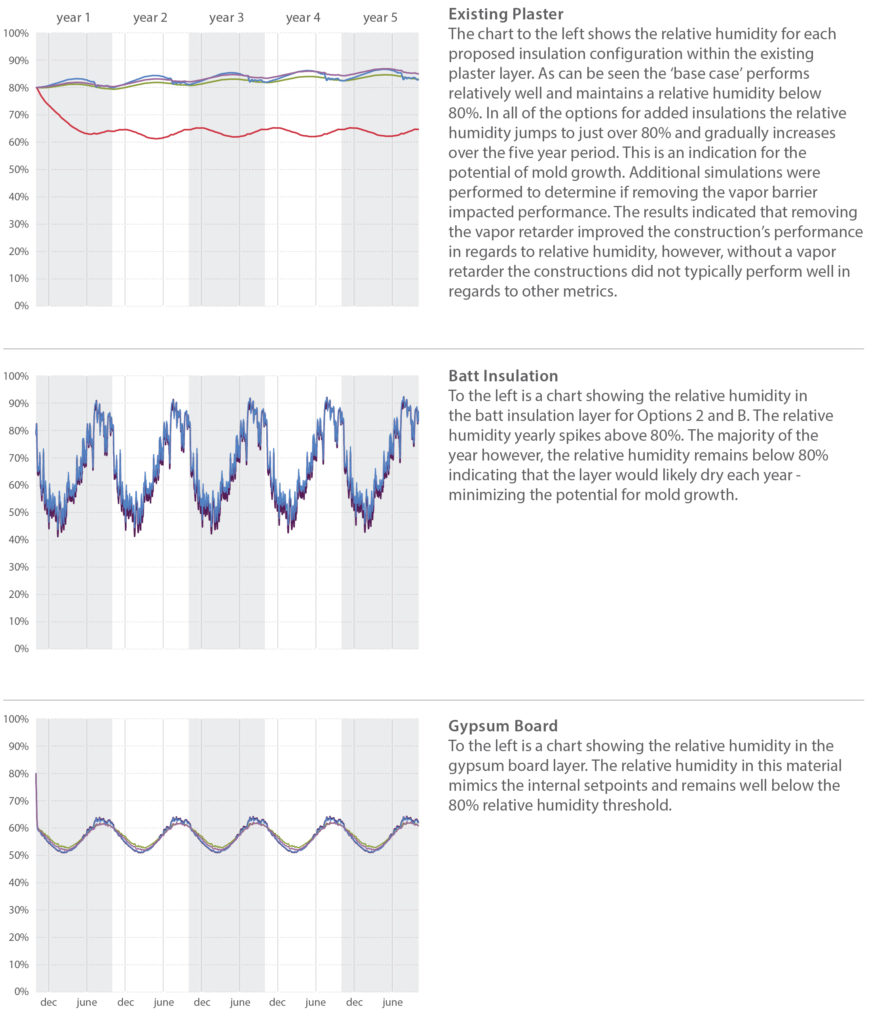
Relative Humidity The relative humidity of the air within the wall construction also has an impact on material longevity and mold potential. A high relative humidity in plaster or batt insulation layers may indicate mold growth, while a high relative humidity in layers with reinforcement may indicate the potential for corrosion. A constant and high relative humidity (above 80%) indicates the potential for mold growth. The charts to the right focus on several susceptible layers, the existing plaster, batt insulation, and gypsum board. In general the majority of the layers susceptible to mold remained below 80% relative humidity, or consistently dropped below 80% relative humidity allowing the material to periodically dry. An exception was the existing plaster layer. The addition of interior insulation caused the relative humidity within the layer to increase approximately 15%, from 65% (base case) to just over 80% (all options for added insulation). This spike in relative humidity is concerning and could indicate the potential for mold growth within the layer.
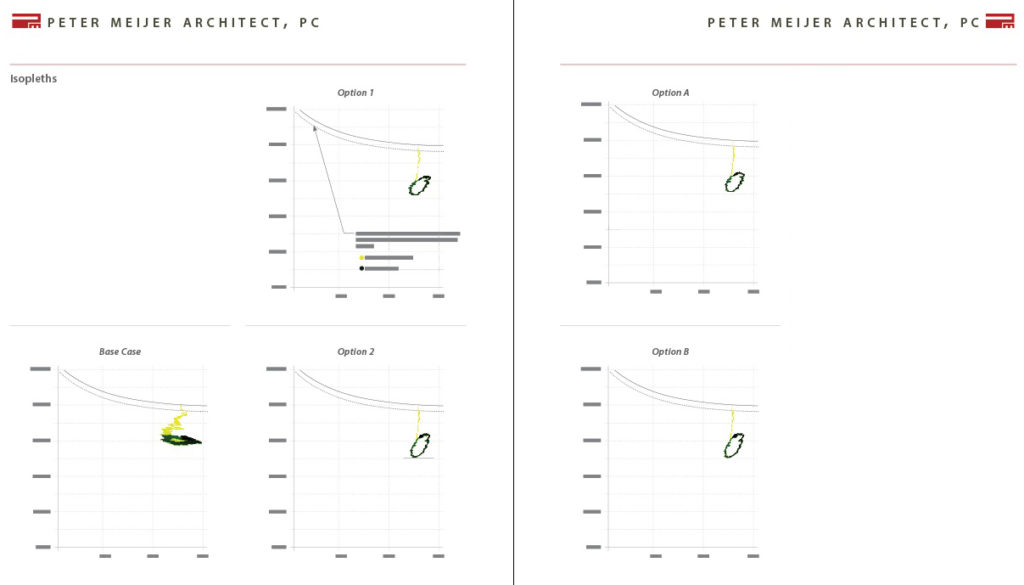
Isopleths WUFI can also predict mold growth by plotting isopleths on the interior surface. The isopleths are plots of the temperature and the relative humidity for every time period calculation. When the temperature and relative humidity both exceed the limiting lines calculated by WUFI there is the potential for mold growth. The simulations indicate that there is very little potential for mold growth. All of the simulations begin above the limiting lines, but over time equalize and remain well below the threshold calculated by WUFI.
CONCLUSIONS
The results described above indicate that there could be some challenges to designing an appropriate insulation system for Wilmer Davis Hall. Three of the primary concerns noted in the above analysis are: increasing total water content quantities; high quantities of water in the batt insulation layers; and consistently high relative humidity’s in the existing plaster layer.
In general Option 1 and Option A performed better than Option 2 and Option B – primarily because they relied on only foam/rigid insulation. This resulted in no risk of mold growth within the insulation layers and no reduction of the R-Value. Concerns were still identified with both Options in terms of total water content and relative humidity in the plaster layer.
Prior to detailing a new wall for construction additional analysis is recommended. Minor changes in material properties can have significant impacts on wall performance. The above analysis has indicated that there is a potential for mold growth, but has not confirmed its likelihood. Most of the metrics indicated no risk of mold growth – however because some of the metrics showed a potential for mold, additional analysis is recommended. Testing of the existing materials and specific data on proposed products should be used to refine this analysis and determine extent of mold growth risk.
Written by Halla Hoffer,AIA, Assoc. DBIA / Associate, Architect
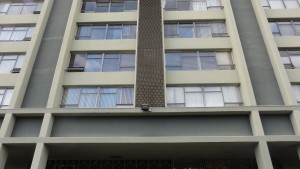
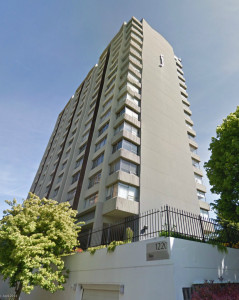 PMA recently performed an energy analysis study to answer that question. The project was to provide quantitative data on the energy savings associated with window replacement versus insulating exterior walls. We choose to study a structure on the brink of historic status – a 1960’s multi-story residential structure with large character defining view windows. The structure is composed of concrete walls, beams, floors, and columns with single pane aluminum windows. The existing building has approximately 36% glazing and no insulation.
 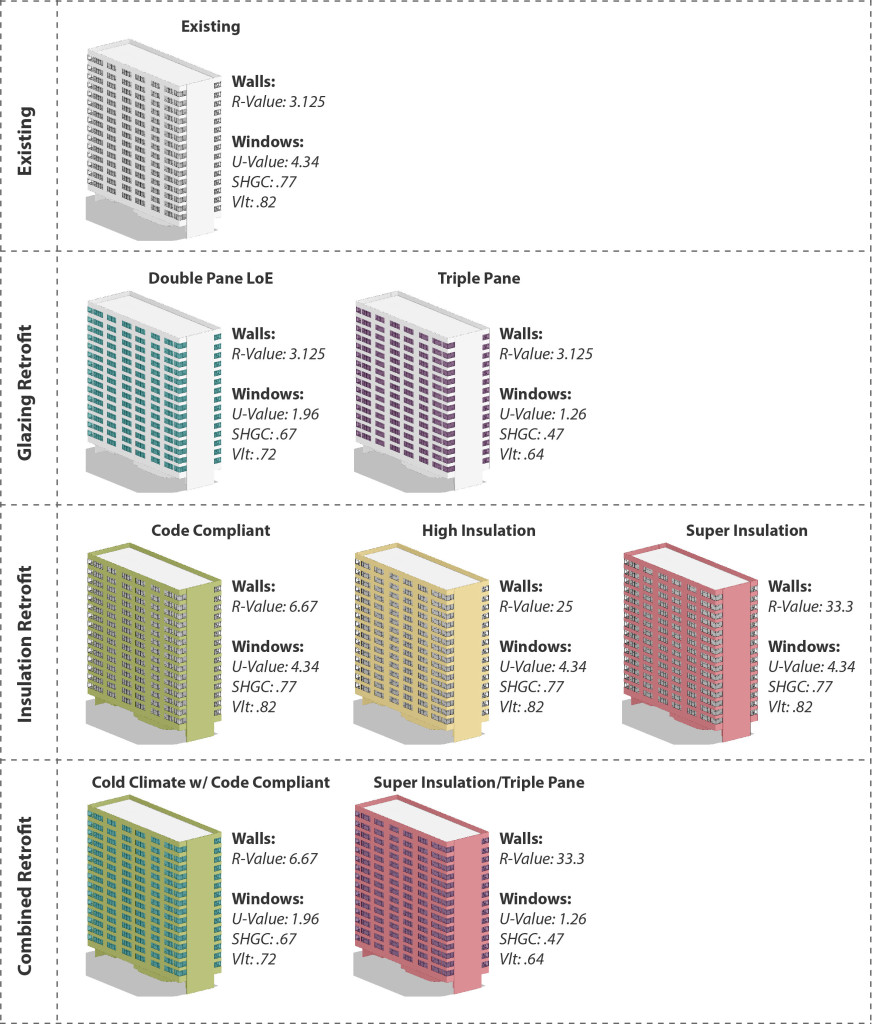 A wide range of constructions were chosen in order to see the full range of possible results. Future studies may focus on more refined material choices and a narrower set of parameters. The analysis was run in Autodesk Green Building Studio which is an excellent tool to perform basic energy models. While GBS does not allow for complex simulations it can quickly and accurately compare a variety of different design alternatives.
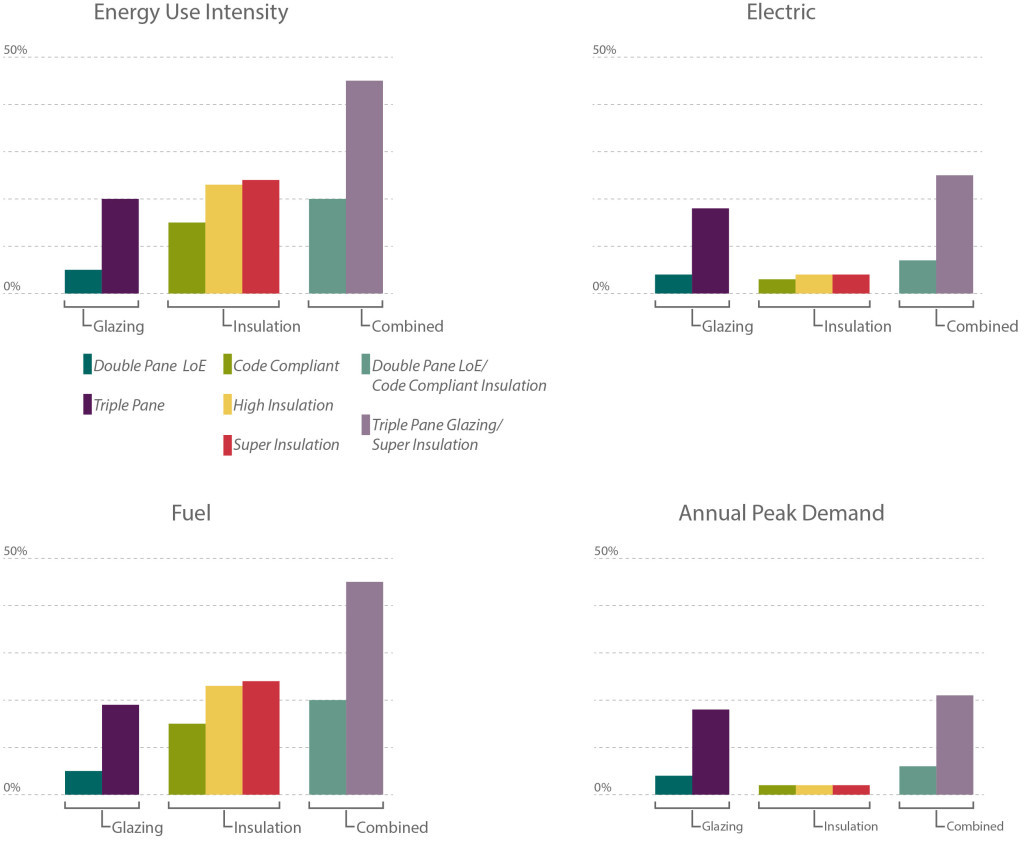
 With current technologies the results indicate that adding insulation to a building has the most cost effective impact on energy performance. Installing new insulation is typically less expensive than window replacement and the results of this study show that Code Compliant (R-~7) insulation can have a significant impact on overall energy usage, outperforming Double Pane window replacement. Interestingly, the results also indicate that a High Insulation (R-25) retrofit performs better than a Combined Retrofit with Code Compliant Insulation (R-~7) and Double Pane Glass.